Bitcoin Price Prediction: BTC/USD Couldn’t Break Above $48,000
Bitcoin Price Prediction – October 2
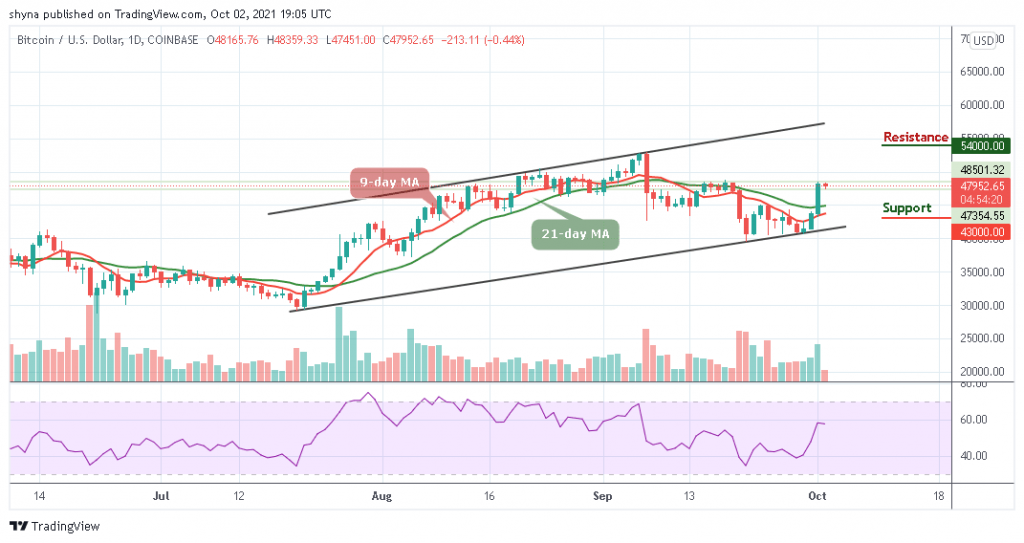
The Bitcoin price prediction reveals that BTC is showing signs of market correction as its price moves below $48,000 to touch the low of $47,451.
BTC/USD Long-term Trend: Ranging (Daily Chart)
Key levels:
Resistance Levels: $54,000, $56,000, $58,000
Support Levels: $43,000, $41,000, $39,000
BTC/USD is currently trading below the $48,000 level as the price moves toward the 9-day and 21-day moving averages. Meanwhile, the consolidation could be coming to play out according to the technical indicator which indicates that the king coin might likely drop more before climbing towards the upper boundary of the channel again.
Bitcoin Price Prediction: Bitcoin (BTC) Could Rebound to the Upside
According to the daily chart, the Bitcoin price is changing hands at $47,952, which could mark a significant rally within the channel. However, where BTC trends next may depend on whether or not sellers can close today’s candle below the $48,000 level. Meanwhile, should in case this comes to play, it may definitely drag the prices lower. More so, looking at the daily chart, traders may expect the king coin to fall below $45,000 support which could later move towards the critical support levels at $43,000, $41,000, and $39,000.
On the contrary, if the Bitcoin price failed to close below the $48,000 level; the price may remain above the 9-day and 21-day moving averages. More so, gaining more positive moves could send the price to the resistance levels of $54,000, $56,000, and $58,000. On the contrary, the technical indicator Relative Strength Index (14) recently reveals a sign of trend reversal, which shows a possible bearish momentum in the market soon.
BTC/USD Medium – Term Trend: Bullish (4H Chart)
On the 4-hour chart, BTC/USD is currently trading around $48,177 above the 9-day and 21-day moving averages after a reversal from $48,195 where the market touched today as the Bitcoin price is now around the upper boundary of the channel.
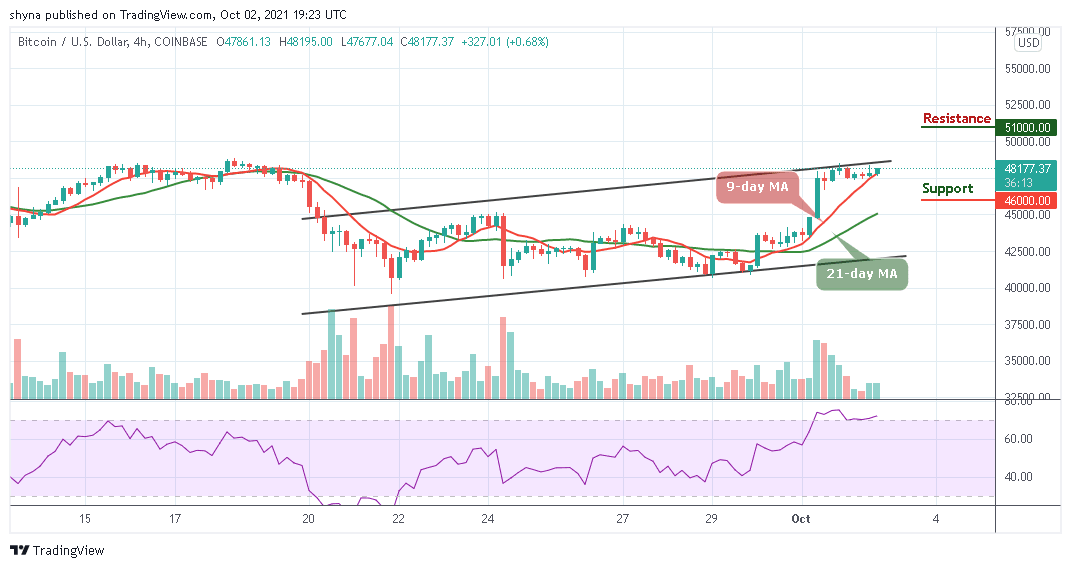
However, in as much as the buyers energize the market, they can push the price above the channel which could take the market price towards $51,000 and above. Meanwhile, the Relative Strength Index (14) is currently moving within the overbought region but any bearish movement to the south may bring the price to the support level of $46,000 and below.
Looking to buy or trade Bitcoin (BTC) now? Invest at eToro!
67% of retail investor accounts lose money when trading CFDs with this provider
Read more:
- How to buy Bitcoin
- How to buy Cryptocurrency