Bitcoin Price Prediction: BTC/USD Establishes A Low Under $50,500
Bitcoin Price Prediction – October 6
The Bitcoin price continues to consolidate underneath a $51,300 barrier and may be doing this for another bullish movement to $52,000 level.
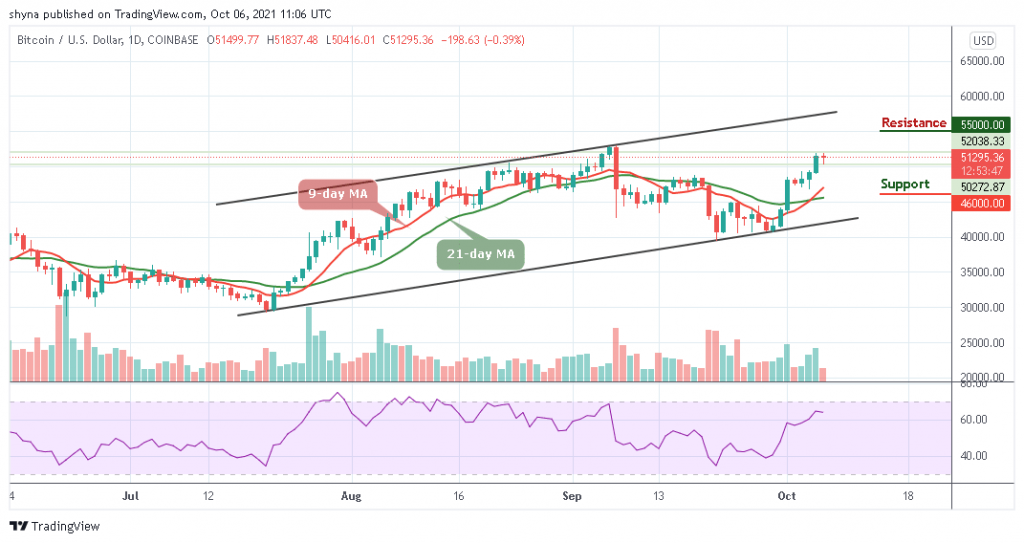
BTC/USD Long-term Trend: Bullish (Daily Chart)
Key levels:
Resistance Levels: $55,000, $57,000, $59,000
Support Levels: $46,000, $44,000, $42,000
BTC/USD today touches the daily high of $51,837 before heading to the downside. During this period, the Bitcoin price is now facing down with 0.39% in the value. It is likely to retain this bearish vibe in the near term as the technical indicator Relative Strength Index (14) may move below 65-level, shifting focus from the upside. At the time of writing, the price of Bitcoin is hovering at $51,295.
Bitcoin Price Prediction: BTC Price Ready to Push Higher Again?
Looking at the daily chart, the nearest support at $51,000 may be tested to the downside as the price consolidates. Failure of the noted support could see the Bitcoin price sliding towards the 9-day and 21-day moving averages. More so, this area is likely to slow down the correction and could serve as a jumping-off ground for another recovery attempt; therefore, if it is out of the way, the support level of $46,000, $44,000, and $42,000 may come into play.
In the meantime, the Bitcoin price recovers from the low of $50,416 but the resistance at $51,800 still stands in the way of movements to $52,000. More so, BTC/USD is still fighting to correct the subtle bearish movement, and the bullish trend coupled with the right volume and high volatility level is the right ingredient for the recovery to $52,000 in other to resume its upward movement towards $55,000, $57,000, and $59,000 resistance levels.
BTC/USD Medium-Term Trend: Bullish (4H Chart)
Checking the 4-Hour chart, BTC/USD is currently trading above the 9-day and 21-day moving averages. The Bitcoin price is hovering around $52,436 and may take time to persistently trade above the upper boundary of the channel. In addition, the upward movement may likely touch the resistance levels of $55,000 and above if the bulls push higher again.
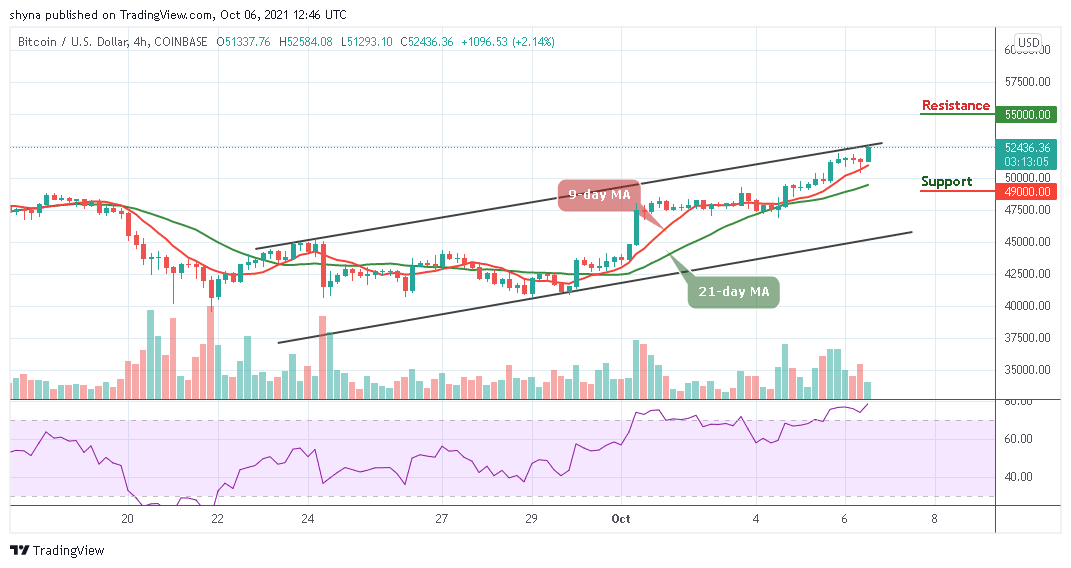
Meanwhile, on the downside, the price could fall below the 9-day moving average if the bears resume back into the market; therefore, a further movement could test the critical support at the $49,000 level and below. Moreover, the Relative Strength Index (14) is still moving within the overbought region, indicating a bullish movement.
Looking to buy or trade Bitcoin (BTC) now? Invest at eToro!
67% of retail investor accounts lose money when trading CFDs with this provider
Read more:
- How to buy Bitcoin
- How to buy Cryptocurrency