Bitcoin Price Prediction: BTC/USD Spikes Above $43,000 Level
Bitcoin Price Prediction – September 26
The Bitcoin price is trading nicely above the $43,000 and the coin may climb above the $44,000 resistance to continue higher.
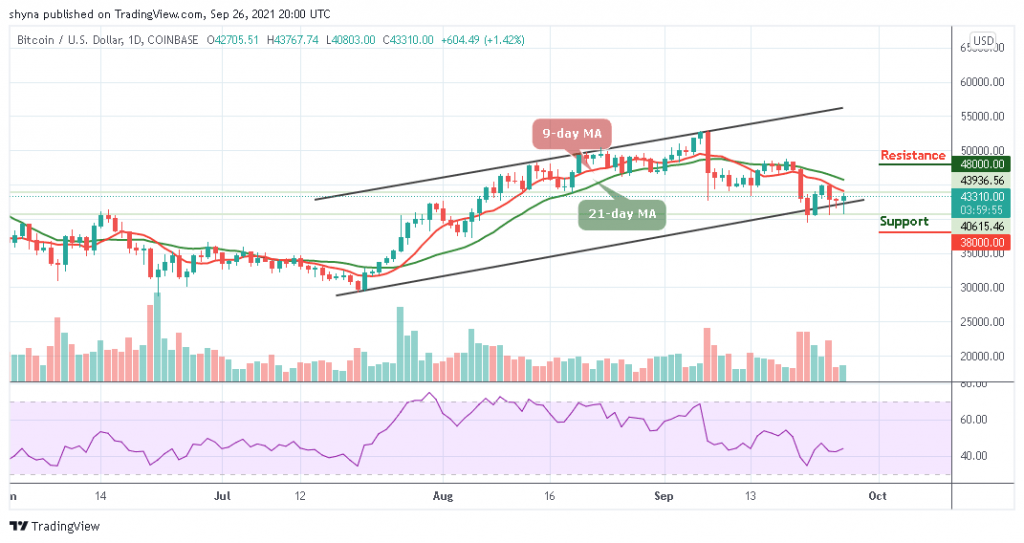
BTC/USD Long-term Trend: Ranging (Daily Chart)
Key levels:
Resistance Levels: $48,000, $50,000, $52,000
Support Levels: $38,000, $36,000, $34,000
BTC/USD begins the day with a downside movement as the coin touches the low of $40,803 in the early hours of today, but later, BTC/USD market begins to improve, moving it out of the downside to the upside. However, within a few hours, the Bitcoin price has moved up from $40,803 to $43,767 and now changing hands at $43,345.
Bitcoin Price Prediction, Bitcoin (BTC) May Consolidate
At the time of writing, the Bitcoin price is finding it too difficult to climb higher above the $44,000 resistance as the coin is likely to move between $43,000 and $44,000 below the 9-day and 21-day moving averages. However, by the time the new uptrend movements are beginning to play out, buyers will use the lower boundary of the channel as the nearest support level. But in as much as the red-line of 9-day MA is below the green-line of 21-day MA, the market may remain at the downside.
On the other hand, if the market decides to go down, BTC/USD may drop to $42,000, and should this support fails to contain the sell-off, the market may see a further drop to $38,000, $36,000, and critically $34,000. Meanwhile, the resistance levels to watch are $48,000, $50,000, and $52,000 respectively. More so, the Relative Strength Index (14) is already moving below 45-level, suggesting sideways movement.
BTC/USD Medium – Term Trend: Ranging (4H Chart)
Looking at the 4-hour chart, the Bitcoin price is currently trading around $43,411 and above the 9-day and 21-day moving averages after a reversal from $40,803 where the market touched today. Meanwhile, we can see that the bullish supply is coming up slowly in the market while the bears are also trying to drag the price down.
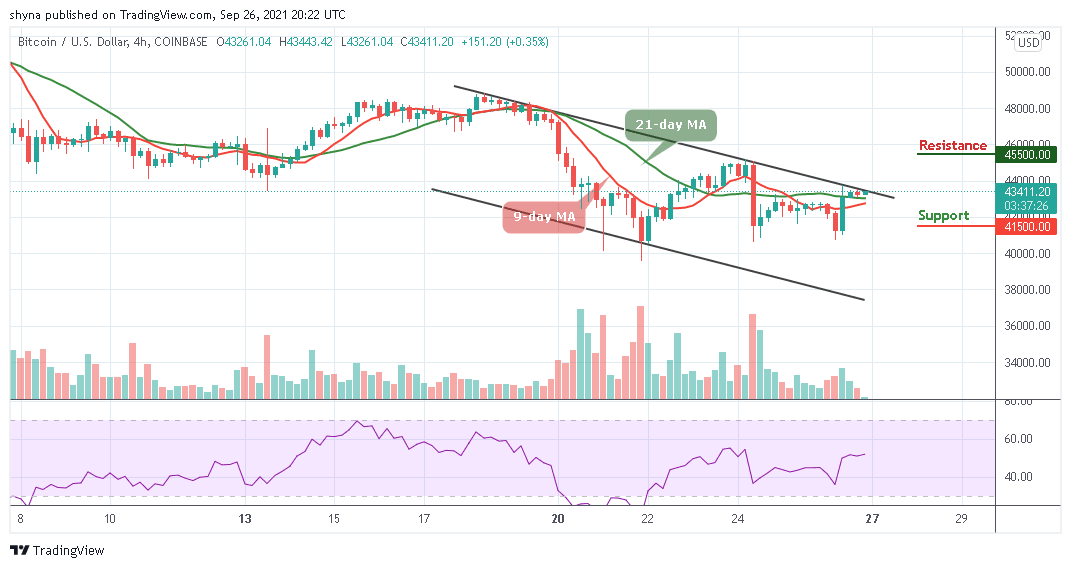
However, if the buyers could strengthen and energize the market, they can further push the price to the $45,000 resistance level. Therefore, breaking the mentioned resistance could also allow the bulls to hit the $45,500 and above. Meanwhile, the Relative Strength Index (14) is currently moving above 50-level, but any movement below the moving averages could welcome the sellers back into the market to hit the support level of $41,500 and below.
Looking to buy or trade Bitcoin (BTC) now? Invest at eToro!
67% of retail investor accounts lose money when trading CFDs with this provider
Read more:
- How to buy Bitcoin
- How to buy Cryptocurrency