Bitcoin Price Prediction: BTC/USD Swings Above $43,500
Bitcoin Price Prediction – September 30
The Bitcoin price restarts the uptrend after crossing above the critical barrier of $43,000 to touch the daily high of $43,622.
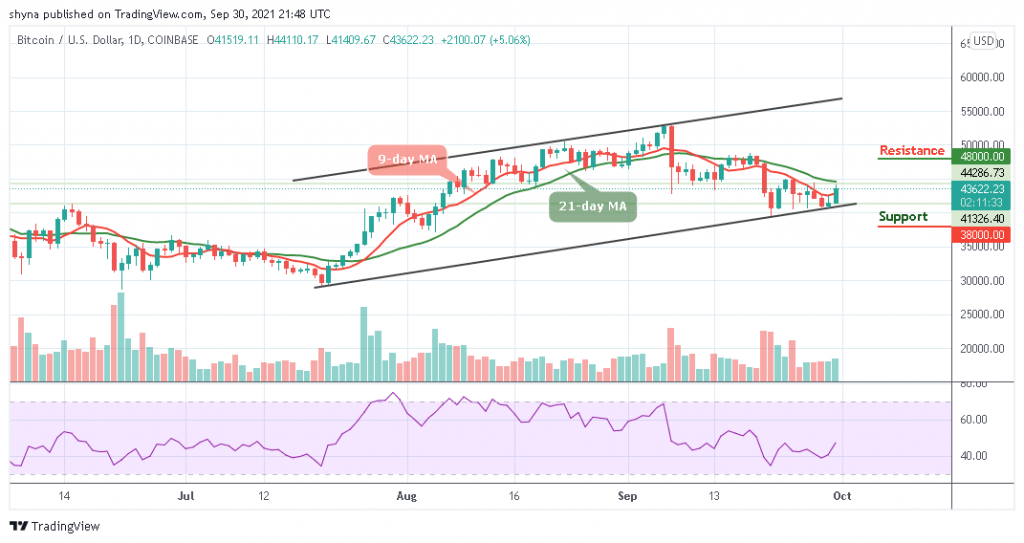
BTC/USD Long-term Trend: Ranging (Daily Chart)
Key levels:
Resistance Levels: $48,000, $50,000, $52,000
Support Levels: $38,000, $36,000, $34,000
BTC/USD looks green today as the price hovers above the resistance level of $43,000 from the low of $41,409. However, a daily close above the $43,000 level may continue to increase the Bitcoin price to $44,000. At the moment, all eyes focus on the next hurdle at $45,000. However, traders should note that a consistent price increase would encourage more investors to join the market as bulls increase their positions.
Bitcoin Price Prediction: Price May Break Higher
At the time of writing, the Bitcoin price is moving marginally at its current price of $43,622 with two straight bullish days. According to the daily chart, this marks a meaningful climb from the opening price of $41,519 level, therefore, it is important to note that the current movement marks a bull-favoring break above the 9-day moving average and could also climb above the 21-day moving average as well.
Nevertheless, if the market decides to fall below the 9-day moving average, the Bitcoin price could go below the lower boundary of the channel, and if that barrier fails to hold the sell-off, traders could see a serious decline towards the support levels of $38,000, $36,000, and $34,000 respectively. All the same, any further bullish movement above the 21-day moving averages may reach the resistance level at $48,000, $50,000, and $52,000 as the Relative Strength Index (14) moves close to 50-level, suggesting more bullish signals into the market.
BTC/USD Medium – Term Trend: Ranging (4H Chart)
According to the 4-hour chart, the Bitcoin price is hovering above the 9-day and 21-day moving averages. However, intraday trading is still looking bullish as a cross above the upper boundary of the channel could hit the resistance level at $46,000 and above.
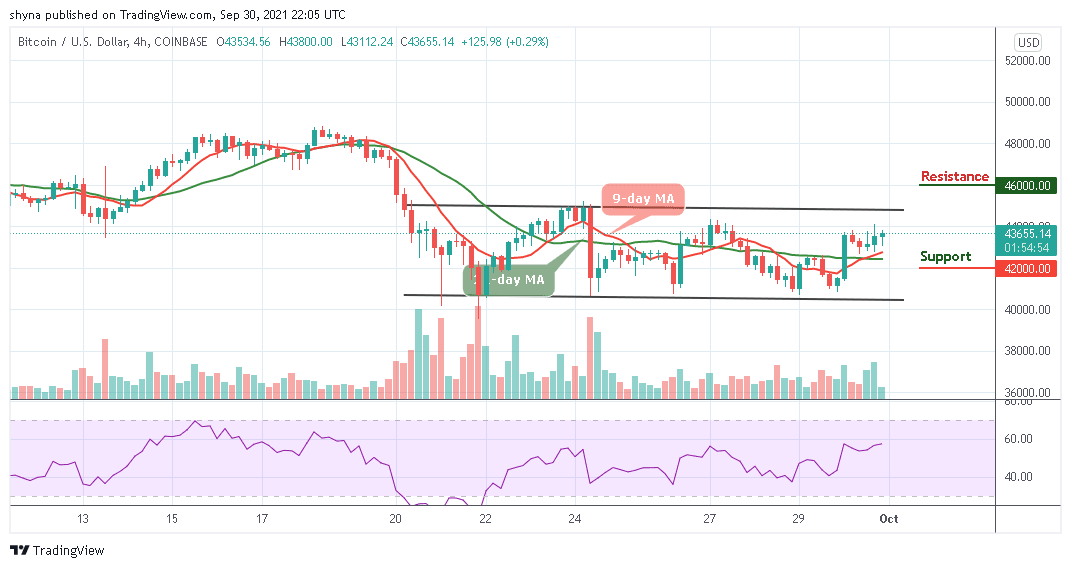
On the contrary, if the buyers failed to keep pushing the market upward, traders can expect a retreat at the $43,000 support level, and breaking this level may further push the price below the 9-day and 21-day moving averages to reach the support level of $42,500 and below. Meanwhile, the Relative Strength Index (14) is seen moving towards 60-level to enter into the positive side.
Looking to buy or trade Bitcoin (BTC) now? Invest at eToro!
67% of retail investor accounts lose money when trading CFDs with this provider
Read more:
- How to buy Bitcoin
- How to buy Cryptocurrency