Bitcoin Price Prediction: BTC/USD Trades Below $40,000
Bitcoin Price Prediction – July 29
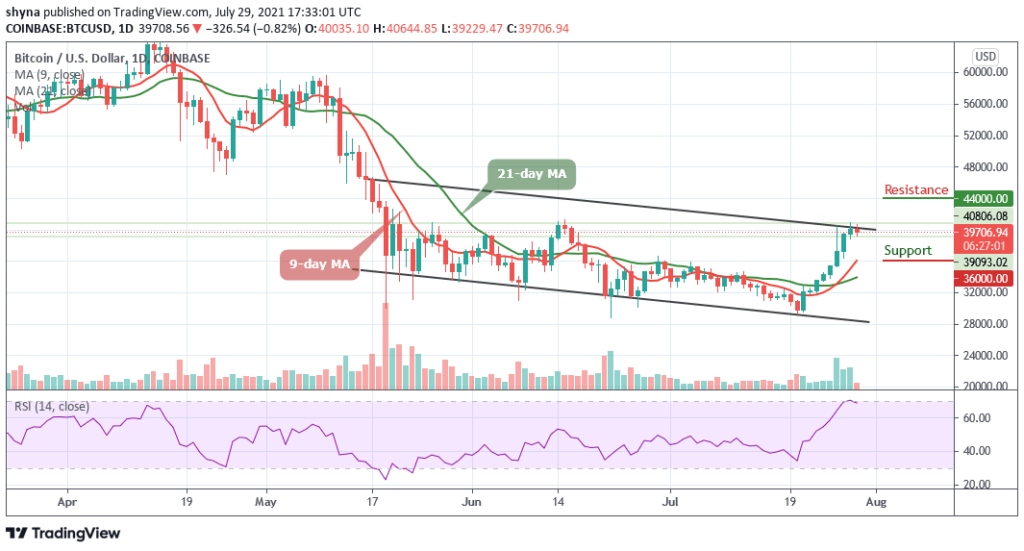
The Bitcoin price is currently down with 0.82% after touching the daily high of $40,644 as it is now moving towards the $39,000 support.
BTC/USD Long-term Trend: Bearish (Daily Chart)
Key levels:
Resistance Levels: $44,000, $46,000, $48,000
Support Levels: $36,000, $34,000, $32,000
BTC/USD failed to break above the upper boundary of the channel with the current consolidation pattern. As the Bitcoin price fails to stay above the $40,600 level, the coin may likely see a sharp drop towards the 9-day and 21-day moving averages. However, the red-line of 9-day MA has crossed above the green-line of the 21-day MA as the Relative Strength Index (14) moves around 70-level.
Bitcoin Price Prediction: BTC Bulls May Need to Gather Momentum
The daily chart reveals that the Bitcoin price refuses to keep moving above the resistance level of $40,000 because the coin may need to gather enough momentum to push higher. The Bitcoin price may set up another few days of negative price declines below the current level of $39,706. Therefore, the first support level could be located at $38,000. Beneath this, other supports lie at $36,000, $34,000, and $32,000. Meanwhile, a break above the previous level of $40,644 could set Bitcoin up to test the $42,000 level.
However, traders can clearly see that BTC/USD could fall below the 9-day moving average if the bears put more pressure.
Although the current candle is still yet to close, however, it is very likely that the bulls may end up closing above the upper boundary of the channel if the bulls return back into the market. Similarly, if the coin rebounds and moves to the upside, BTC/USD could locate the potential resistance levels of $44,000, $46,000, and $48,000.
BTC/USD Medium-Term Trend: Bullish (4H Chart)
The 4-hour chart shows that the Bitcoin bears are now stepping back into the market pushing the BTC price below its previous support level that existed around $39,700. Although the Bitcoin price has not yet slipped below $39,000, it’s still in the loop of making a bounce back.
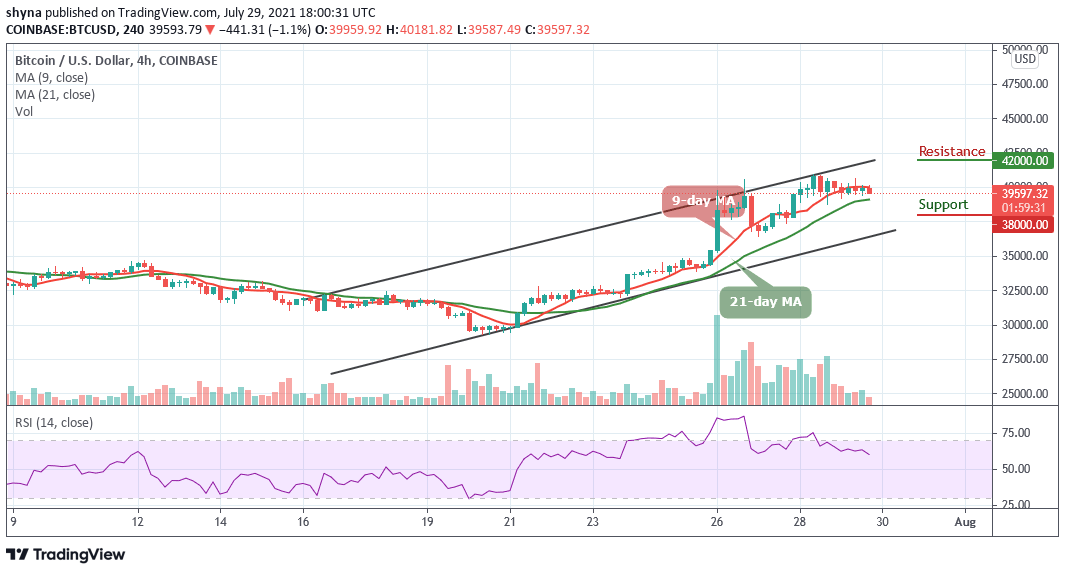
At the moment, the Bitcoin price is likely to cross below the 21-day moving average as it is currently trading below the 9-day moving average but the upward movement may likely push the price to the nearest resistance at $42,000 and above. On the contrary, any further bearish movement may locate support at $38,000 and below as the technical indicator Relative Strength Index (14) moves below 65-level.
Looking to buy or trade Bitcoin (BTC) now? Invest at eToro!
67% of retail investor accounts lose money when trading CFDs with this provider