Ethereum Price Prediction: ETH/USD Market Maintains Fluctuating Situation at $3,000
Market Maintains Fluctuating situation at $3,000– September 29
The ETH/USD market maintains fluctuating situation around the level of $3,000 as the crypto activity price trades at a percentage estimate of about 4.17. The market makes a trading level record of around $2,923 as of writing.
Market Maintains Fluctuating situation at $3,000: ETH Market
Key Levels:
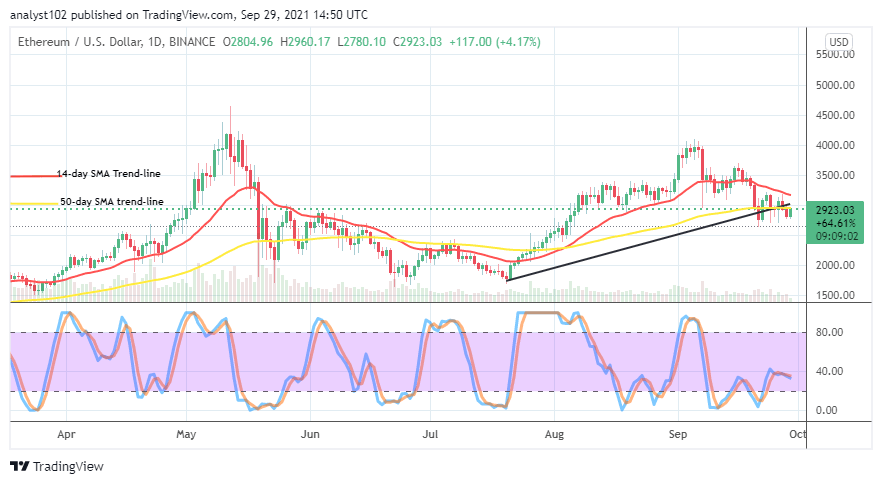
Resistance levels: $3,250, $3,750, $4,250
Support levels: $2,500, $2,250, $2,000
ETH/USD – Daily Chart
The ETH/USD daily chart depicted that the crypto market maintains fluctuating situation around the line of $3,000 for a while, making long dwelling in a definite direction indecisive more often than none. The 14-day SMA trend line slightly bends southward above the 50-day SMA trend line. The Stochastic Oscillators are with closed lines around the range of 40. That portends that price may continue to feature in range moving manner until a while.
Will the ETH/USD price continue to move around $3,000 as the market maintains fluctuating situation?
There is still every possibility that the ETH/USD price valuation features more until the subsequent trading sessions just now as the crypto market maintains fluctuating situation around the level of $3,000. In the progression of that presumed scenario playing out, there will be gladdening entry situation for a long position at a dip-trading zone especially, when price tends to move southward in a bid of averaging lower lines.
On the downside, a round of price pulling-up conditions needed to occur, testing a high mark between the $3,000 and $3,500 and that should eventually get a weakening sign to the upside momentum before the ETH/USD market bears can consider placing sell orders. Short-position takers needed to be cautious of late entry or jumping into the market while price action approaches the stage of downward movement completion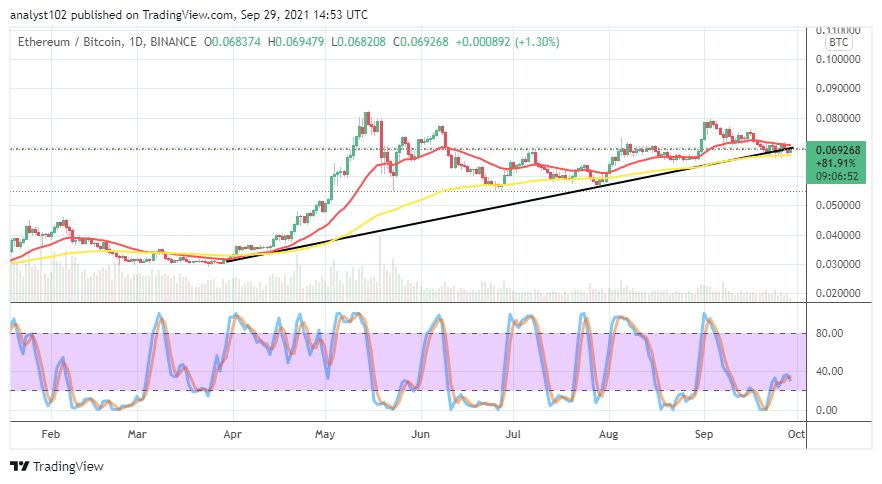
ETH/BTC Price Analysis
The ETH/BTC price analysis shows that the currency pair market maintains fluctuating situation around the trading indicators at a high trading spot. It means that the trending performance between the base crypto and the flagship counter crypto, the former instrument still holds its position relatively firm in comparison until now. The 14-day SMA indicator is over the 50-day SMA indicator. The Stochastic Oscillators are seemingly attempting to cross the lines southbound beneath the range line of 40. That suggests that Ethereum’s trending capability against Bitcoin may face a set of drop-offs for a while.
Looking to buy or trade Ethereum (ETH) now? Invest at eToro!
67% of retail investor accounts lose money when trading CFDs with this provider.
Read more:
- How to buy Ethereum
- How to buy cryptocurrency