Litecoin Price Prediction: LTC/USD Market Hovers Tightly at $150
Litecoin Market Hovers Tightly at $150 – September 26
The LTC/USD financial book of records now has it that the crypto market hovers tightly around the line of $150. And, that point still serves as the lower range line. The percentage estimate at which the market trades is about 0.01, trading at the level of 151 in approximation. That gives an intrigue that the crypto valuation may soon regain strength to some extent.
Market Hovers Tightly at $150: LTC Trade
Key Levels:
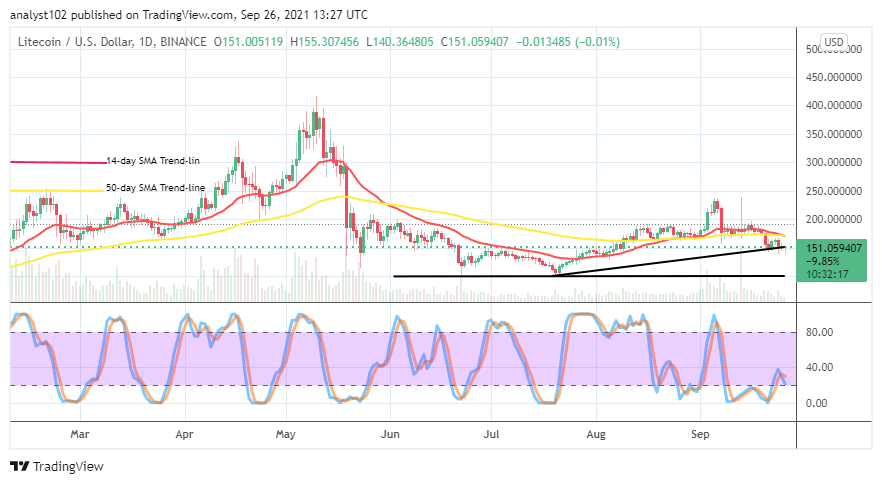
Resistance levels: $180, $220, $260
Support levels: $130, $110, $90
LTC/USD – Daily Chart
The LTC/USD daily chart exhibits that the crypto-economic market hovers tightly around the $150 underneath the SMA indicators. The 14-day SMA trend line has bent southward to conjoin with the 50-day SMA trend line from the top. The bullish trend line drew, marking a supportive point beneath the SMAs at the value line mentioned earlier. The Stochastic Oscillators have crossed the lines southbound between the ranges of 40 and 20 to signify that declination of valuation is relatively ongoing.
Should traders expect more downs beneath $150 as the LTC/USD market hovers tightly around it?
The expectation isn’t that high that more stable downs will feature beneath the $150 even now that the LTC/USD market hovers around it. Around that point, bulls needed to be on the lookout for repositioning against any possible downward motion that the market tends to witness. Below or around that value line, there are some underlying opportunities for both buyers and investors to re-launch their positions.
On the downside of the valuation of this crypto economy, the LTC/USD market bears needed to be extraordinarily careful about exerting new short-positions around the $150 line. Suspension of the sell-trading position may hold for a while. Even though the market currently wallows under a falling force, the technical trading outlook has it that price has again reached a critical lower zone that could in the near time turn against new shorting orders at that capacity level.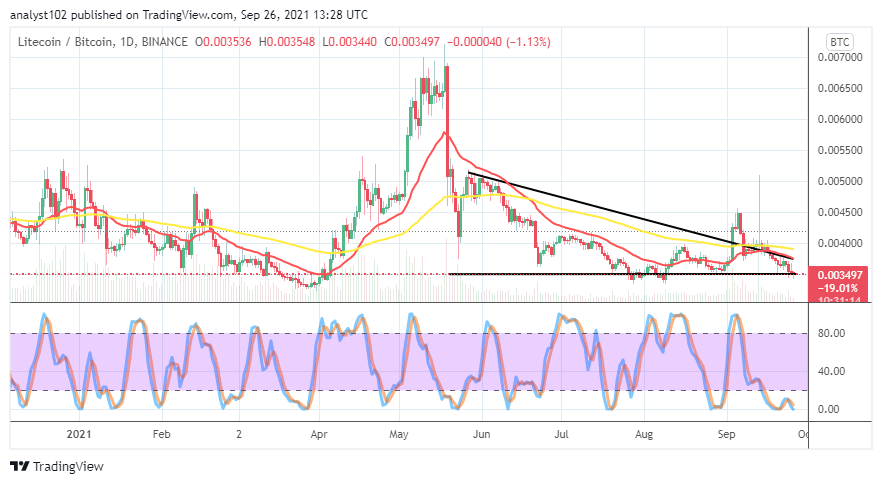
LTC/BTC Price Analysis
In comparison, the Litecoin versus Bitcoin price analysis chart showcases that the cryptocurrency pair market hovers tightly around the concurrent previous critical lower trading line beneath the indicators. The bearish trend line drew southward to align with the 14-day SMA trend line at the tail end beneath the 50-day SMA trend line. The Stochastic Oscillators are seeing closely, touching the critical zero line in the oversold region. That raises an expectation that the base crypto will probably surge against its counter crypto soon.
Looking to buy or trade Litecoin (LTC) now? Invest at eToro!
67% of retail investor accounts lose money when trading CFDs with this provider.
Read more:
- How to buy Litecoin
- How to buy cryptocurrency