Litecoin Price Prediction: LTC/USD Market Re-bounces at $175

Litecoin Market Re-bounces at $175 – October 28
It recorded that the LTC/USD market re-bounces around $175 while a volatility motion took place during yesterday’s sessions. Presently, the crypto’s price worth trades around $188 at a percentage rate of 5.20 positive. That signifies that the market embarks on a notable recovery process.
Market Re-bounces at $175: LTC Trade
Key Levels:
Resistance levels: $200, $225, $250
Support levels: $150, $125, $100
LTC/USD – Daily Chart
The LTC/USD daily chart has brought to the limelight that the crypto market re-bounces around the level of $175 after witnessing a significant drawdown during a volatile operation yesterday. It observed that the rebounding process came up short while the depression briefly went past the psychological value line. The 14-day SMA indicator is closely above the 50-day SMA indicator in the ranges of $200 and $150. The Stochastic Oscillators are positioned around the range of 20, seemingly trying to close the lines. That suggests that price may be settling to diverge from its course to the downside partially.
Should traders keep to range-bound trading techniques as the market re-bounces at $175?
It still appears that there is a need for traders to keep to range-bound trading techniques as the LTC/USD market re-bounces at $175, during yesterday’s trading session at a higher range trading spot down to a lower zone to find support before reaching the lower range line at $150. Being as it is, the range-bound zones carry three differential lines as the mid-point is said to be the point firstly mentioned in this analytical article.
On the downside of the technical analysis, sellers may have to wait for price reactions at a higher range-trading zone before deciding the subsequent approach to apply. A reversal of the current rebounding price motion against $175 will potentially allow the market to revisit the lower range line.s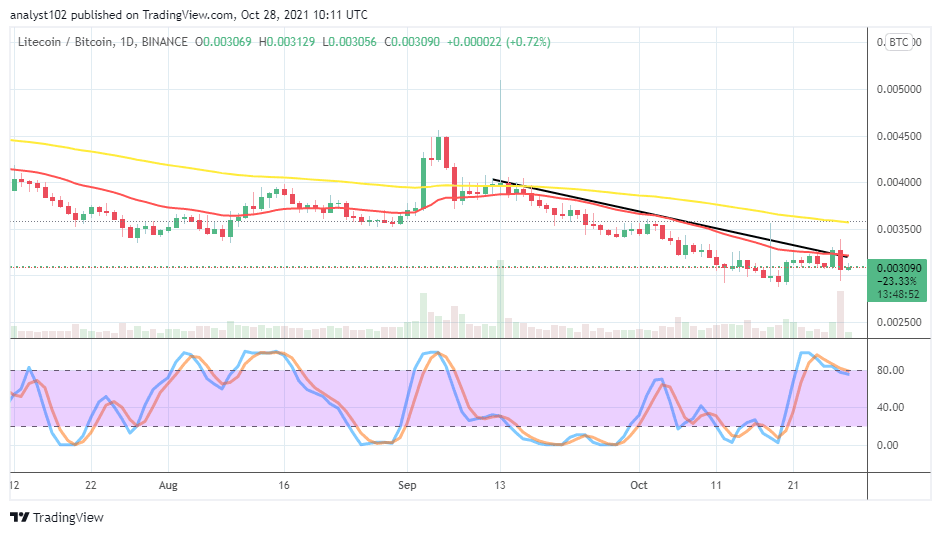
LTC/BTC Price Analysis
In comparison, the trending capability of Litecoin as placed side by side with Bitcoin’s is still waxing at a higher-lower trading zone around the trend line of 14-day SMA. The 50-day SMA indicator is above the 14-day SMA indicator. The Stochastic Oscillators are slantingly positioned southbound from the overbought region briefly against the range of 80. That suggests that the duo-crypto market pair may still face a downward progression movement in the near time.
Looking to buy or trade Litecoin (LTC) now? Invest at eToro!
68% of retail investor accounts lose money when trading CFDs with this provider.
Read more:
- How to buy Litecoin
- How to buy cryptocurrency