Litecoin Price Prediction: LTC/USD Spikes past the Resistance Level of $240

LTC Price Prediction – April 11
The market worth of LTC/USD has successfully breached to the north above the critical resistance of $240 during yesterday’s trading session. The last time that the crypto attempted was on March 13 when the resistance line was only tested.
LTC/USD Market
Key Levels:
Resistance levels: $280, $300, $320
Support levels: $200, $1800, $160
LTCUSD – Daily Chart
A big bullish candlestick has emerged on the LTC/USD daily trading chart to possibly signal the long-awaited northward-moving continuation. The 14-day SMA trend-line is a bit curved to the north to signify an upward move in motion under the bullish trend-line. The Stochastic Oscillators are moving in a consolidation around range 80. But, now, they are of more crossing the hairs to point to the north. It indicates that more buying pressures will continually be experienced in this crypto-trading activity.
Will there continue to be more ups in the LTC/USD trading operations?
With the emergence of a strong push above the key resistance trading line of $240, the LTC/USD bulls are most likely to get easy pushes further to the north. The big spike bottomed on the support line of $220 to set a buying wall up to a high point of $260. Price is currently trading around the level. More potential featuring ups are expected to build around the long spike in near sessions..
As regards the downward trading move of this crypto-economy, bears will have to wait for a formation of price convergences at a later higher trading zone. The sell-placing order must be exercised while there is a strong bullish reversal candlestick in the forming. It has to be noted that a bearish trading outlook as regards the present northward trend must be treated with utmost carefulness.
LTC/BTC Price Analysis
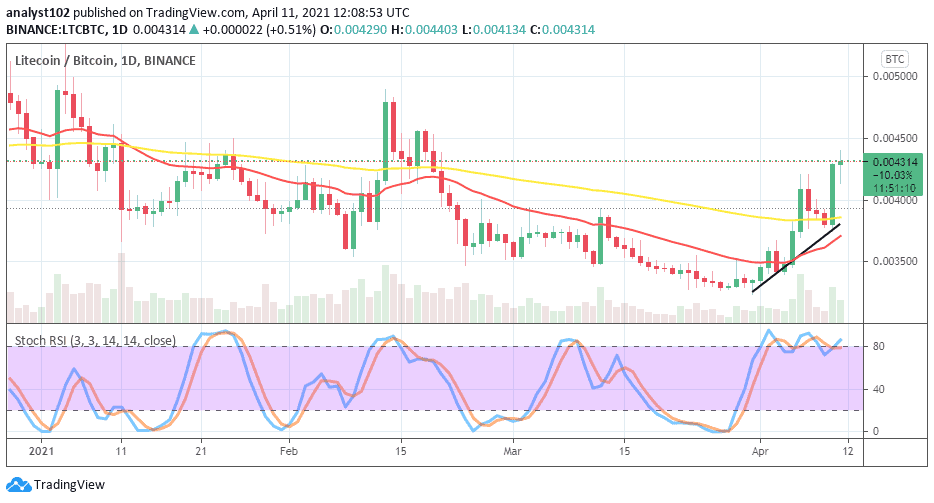
Even though some cryptos are pushing against the most valued crypto’s price in comparison, the overall market-trend outlook between LTC and BTC is still relatively bearish. The daily trading chart shows that the base crypto has a very long way to go as regards the purchasing power with the counter crypto. However, Litecoin seems to have begun the journey as it has traded past all the indicators to the north. The 14-day SMA trend-line now points towards the north below the 50-day SMA trend-line. The Stochastic Oscillators are moving in a consolidation manner around range 80 nearing into the overbought region. It has been indicated that the base trading instrument will have a kind of smother run in a near session.


