Bitcoin (BTC/USD) Price Trades Below $45,000 Resistance
Bitcoin Price Prediction – September 27
The BTC/USD financial book of record now has it that the crypto’s price trades below the line of $45,000. The market is rading around $43,729 at a percentage rate of about 0.64. That gives an insightful technical notion that price pushes up relatively as of writing.
BTC/USD Market
Key Levels:
Resistance levels: $45,000, $47,500, $50,000
Support levels: $40,000, $37,500, $35,000
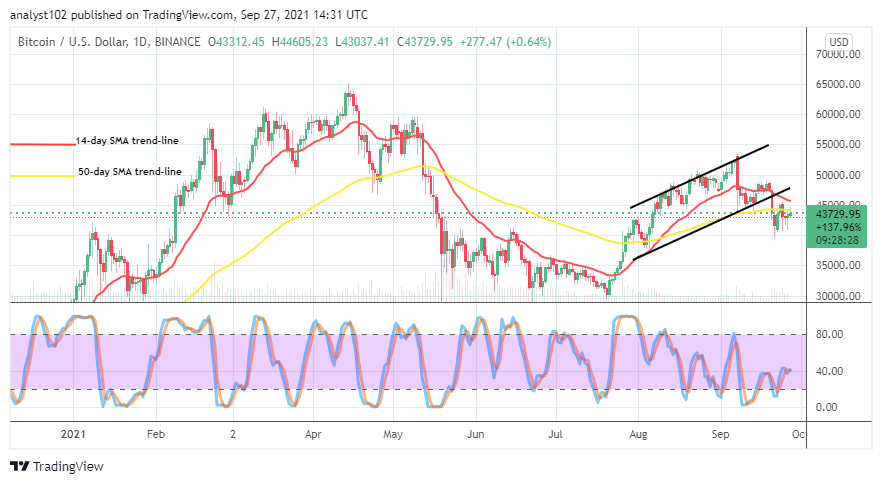
BTC/USD – Daily Chart
The BTC/USD daily chart shows that the crypto-fiat currency price trades below $45,000 resistance level as the SMAs briefly keep southward-curved postures around the point. The 14-day SMA trend line is over the 50-day SMA trend line. The Stochastic Oscillators have closed the lines at range 40. That suggests that the market may need some times to decide the next possible direction from it current trading zone.
Could there be a reliable upsurge against $45,000 resistance level in the following sessions as the BTC/USD price trades below it?
It may still take a while before there can be a notable breakout at the $45,000 resistance level as the BTC/USD price trades below it currently. An achievable belief over a couple of trading days’ sessions is that there are some levels of lower supports around $40,000 that bulls may have to be on the lookout for while price makes a slight downward motion. If there will be violent push beneath the higher value line mentioned earlier, strong support may eventually feature around $37,500 lower line.
On the downside, the resistance level at $45,000 will most likely be the area of trading that short-position takers needed to put more focus on as price may revert. On the contrary to that, a sudden breakout of the point can’t be overruled as it is indicated that there are much ranges of resistance trading lines to breach northward than breaching southward through support levels.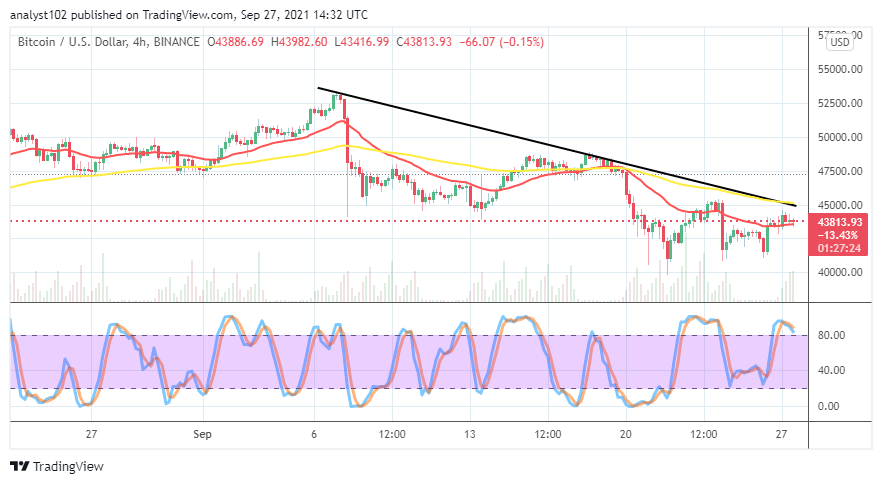
BTC/USD 4-hour Chart
The BTC/USD medium-term chart showcases the crypto-economic price trades below the level of $45,000 around the trend line of the smaller SMA. The 50-day SMA is over the 14-day SMA. The bearish trend line is drawn over the SMAs to indicate that the market is somewhat under selling pressure. The Stochastic Oscillators are in the overbought region with crossed lines, trying to cross southbound. That signifies that a downward force is imminent.
Looking to buy or trade Bitcoin (BTC) now? Invest at eToro!
67% of retail investor accounts lose money when trading CFDs with this provider.
Read more:
- How to buy Bitcoin
- How to buy cryptocurrency