Bitcoin Price Prediction: BTC/USD Begins Fresh Bull-Run Above $58,000 Level; Bullish Confirmation?
Bitcoin (BTC) Price Prediction – April 9
The Bitcoin price is expected to break out from the current short-term pattern and move towards the $59,500 level.
BTC/USD Long-term Trend: Bullish (Daily Chart)
Key levels:
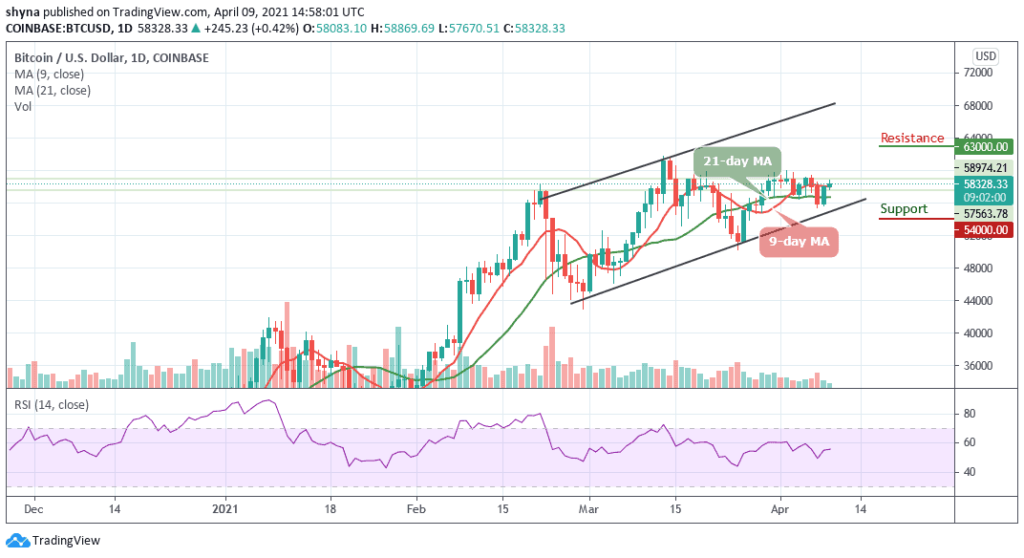
Resistance Levels: $63,000, $65,000, $67,000
Support Levels: $54,000, $52,000, $50,000
BTC/USD is currently trading around $58,328 with a 0.42% gain in the past 24-hour. According to the daily chart, since the beginning of today’s trading, the Bitcoin price fights to stay above the important level of $58,000. More so, for BTC/USD to remain above $57,000 for the past few days, it has made many traders feel that the $55,000 support level could be pretty strong.
Where is BTC Price Going Next?
BTC/USD touches the daily low of $57,670 today, if the number-one crypto breaks below this level, it could test the next support lines at $56,000. Alternatively, Bitcoin has to reclaim the first resistance at $59,500 to head upwards. If successful, the primary cryptocurrency could aim at $60,000, followed by $61,000, and $62,000 resistance levels.
However, the technical indicator RSI (14) is moving in the range as the Bitcoin price is not done with the downside. More so, this means that there may still be a room that could be explored by the bears. If this happens, the critical supports at $54,000, $52,000, and $50,000 may play out.
On the upside, recovery may not come easy. Therefore, traders must be aware that support will have to be sort for above $57,300 while the other seller congestion zones to keep in mind include $63,000, $65,000, and $67,000 resistance levels.
BTC/USD Medium – Term Trend: Bullish (4H Chart)
From a technical point of view, on the 4-hour chart, the technical indicator RSI (14) keeps moving below the 55-level and this supports the option of some bullish correction. Meanwhile, adding to the above, there is a little bit of bullish divergence on the RSI (14) as the signal line faces the south.
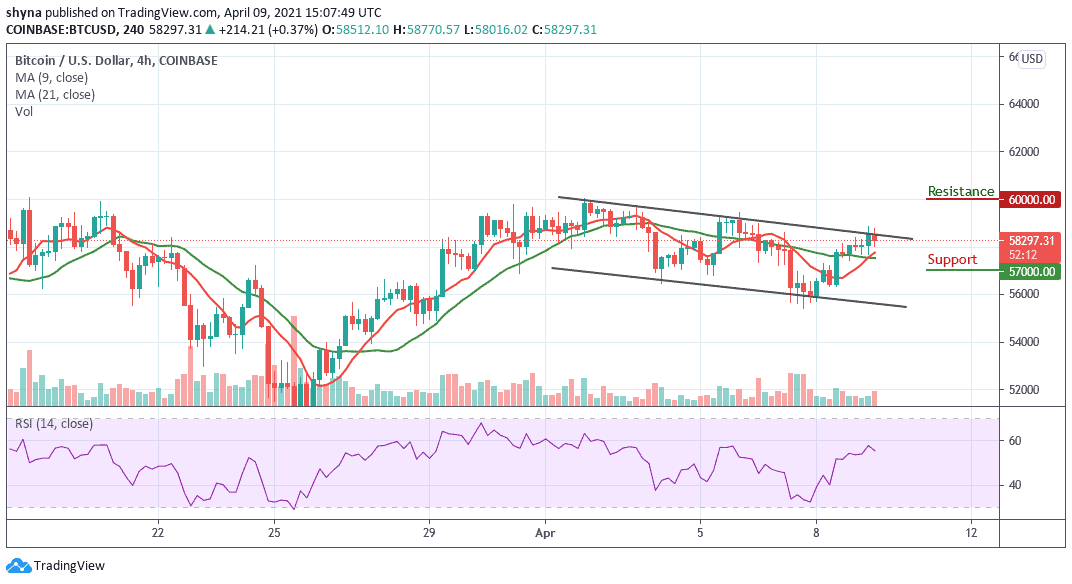
However, if the Bitcoin price breaks below the 9-day and 21-day moving averages, the market price may likely reach the supports at $57,000 and below. On the contrary, if the current market value rises above the upper boundary of the channel, it may likely reach the resistance at $60,000 and below.