Bitcoin Price Prediction: Watch Out as BTC/USD Bulls May Hold the Price Above $58,000
Bitcoin (BTC) Price Prediction – April 4
The Bitcoin price is trading nicely above the $58,000 as the coin may need to climb more to continue higher.
BTC/USD Long-term Trend: Bullish (Daily Chart)
Key levels:
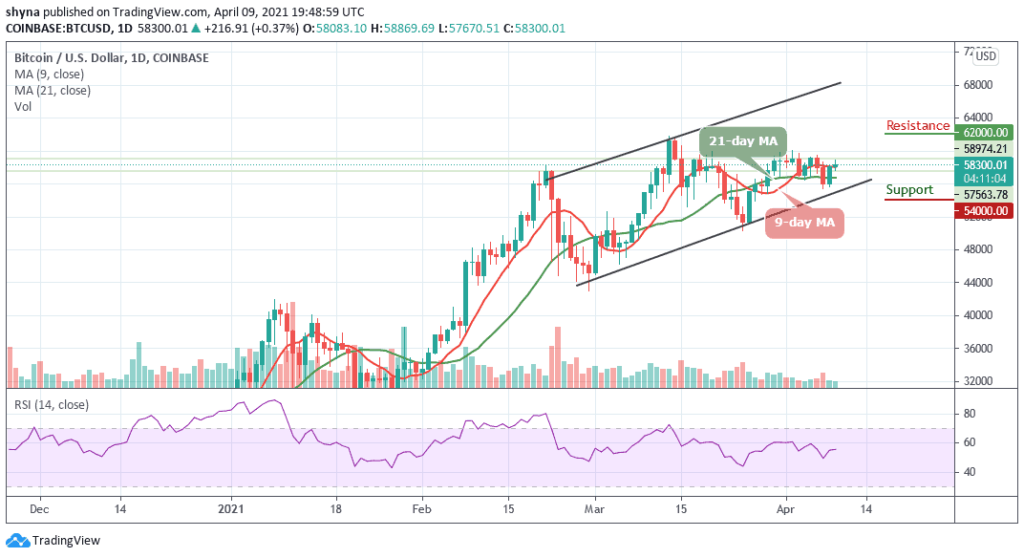
Resistance Levels: $62,000, $64,000, $66,000
Support Levels: $54,000, $52,000, $50,000
BTC/USD begins the day with a downside movement as the coin touched $57,670 in the early hours of today, but later, the coin is now improving by moving out of the downside to the upside. However, within a few hours of the day, BTC/USD is now moving up from the daily low to $58,869 and now changing hands at $58,300.
Where is BTC Price Going Next?
At the moment, BTC/USD is still finding it difficult to touch the $59,000 resistance as the coin is settling in a tight range between $55,000 and $59,000 around the 9-day and 21-day moving averages. Typically when the new uptrend movements are beginning to form, buyers may use the 21-day moving average as the nearest support level. But in as much as the 9-day MA keeps moving above the 21-day MA, the market may continue to follow the upward movement.
However, if the market decides to go down, we may see a further drop to $54,000, $52,000, and critically $50,000. More so, the resistance levels are located at $62,000, $64,000, and $66,000 respectively. Meanwhile, the signal line of RSI (14) may likely cross above the 60-level to suggest more bullish signals.
BTC/USD Medium – Term Trend: Bearish (4H Chart)
Looking at the 4-hour chart, Bitcoin’s price is currently trading around $9,710 and above the 9-day and 21-day moving averages. The chart also reveals that the bullish supply is coming up slowly in the market, but the bears are also trying to drag the price down. Meanwhile, the $57,000 support and below may come into play if BTC breaks below the moving averages.
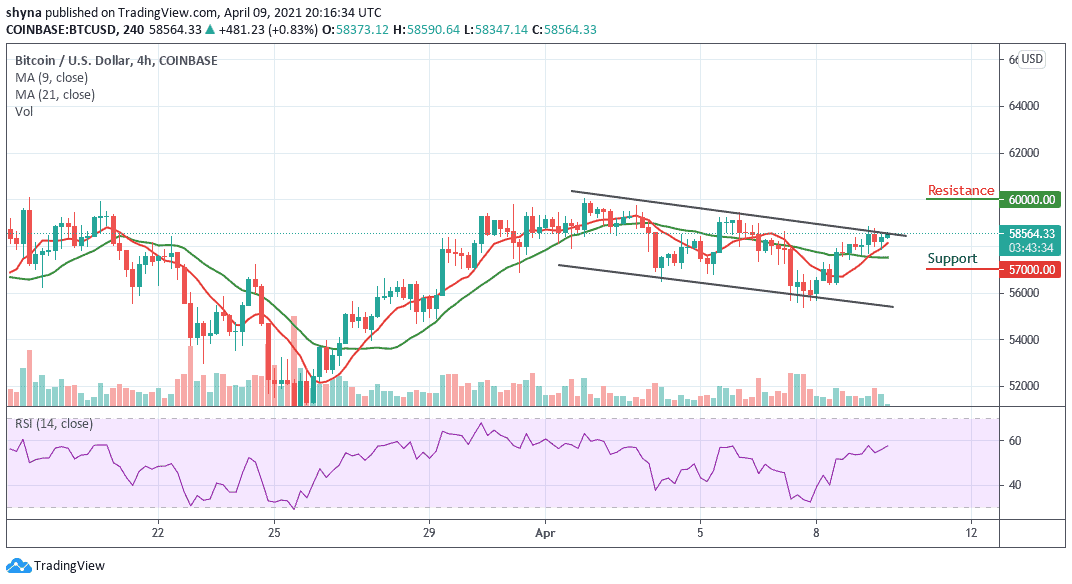
Nevertheless, as soon as bulls push the coin above the channel, traders can expect more uptrends. Therefore, breaking the mentioned barrier could also allow the bulls to touch the $60,000 and above. However, BTC/USD is consolidating currently and moving sideways on the medium-term outlook as the RSI (14) moves in the same direction.