XRP Price Prediction: XRP/USD Market Downsizes at $1
XRP Market Downsizes at $1– September 28
The Ripple XRP/USD market downsizes business operations around the line of $1. Currently, the crypto market trades around $0.92 at a positive percentage rate of 0.80. That shows that the crypto trade may also make some moves showing a promissory upside sign.
XRP Market Downsizes at $1: XRP Market
Key Levels:
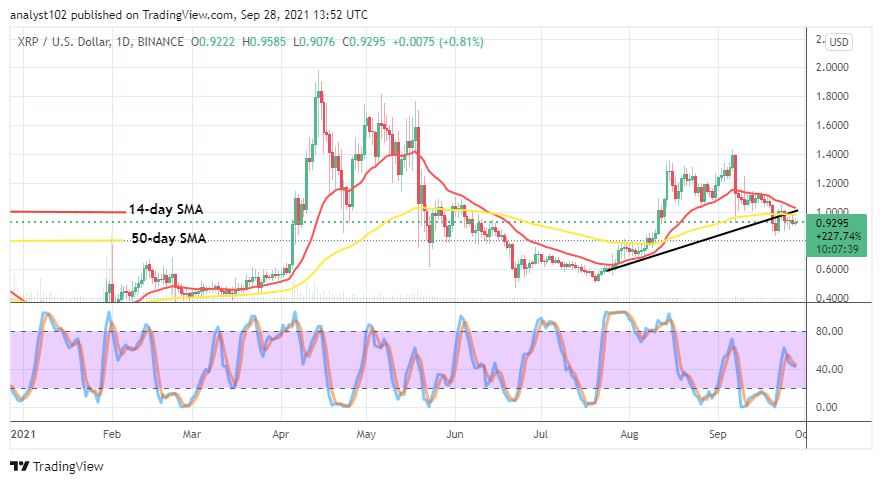
Resistance levels: $1.10, $1.30, $1.50
Support levels: $0.80, $0.60, $0.40
XRP/USD – Daily Chart
The Ripple XRP/USD daily chart now shows that the crypto-economic market downsizes around the level of $1. A notable bearish candlestick occurred on September 20th against the value-line as another bullish candlestick featured on September 22nd, leading the subsequent variant candlesticks to come up in lower lows closely beneath the trading indicators. The 14-day SMA trend line slightly curves southward, nearing the 50-day SMA trend line from the top. The bullish trend line drew to support the SMAs. The Stochastic Oscillators have crossed briefly at range 40. That could mean that the market may witness a pause around its trading zone for a while.
Should traders rely on any possible downward force below the $1 level as the market downsizes around it?
There can still be another strong rejection of price action around the level of $1 that can make the Ripple XRP/USD market downsizes again. Price may concurrently hold the valuation lower closely around $0.80 for a while. A fearful downward breach will create a tough trading time against getting reliable buy entry in the subsequent activities. Nevertheless, investors may continue to consider buying variant dips.
On the downside, it indicated that the present main trading barrier line has been at the $1 level. As a result of that notion, bears would have to pull up their muscles to cause a depression in the market around that point. Late sell entry may result in a whipsawing situation. Traders intending to launch a sell order should watch for decent entry opportunities as early as they feature around the point.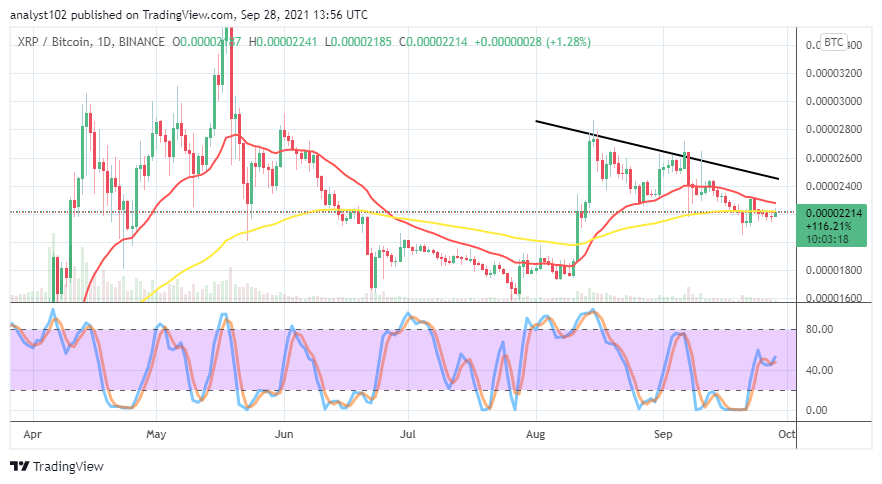
XRP/BTC Price Analysis
The Ripple XRP/BTC price analysis chart shows that the cryptocurrency pair market downsizes around the trend line of the bigger SMA. The 14-day SMA indicator is over the 50-day SMA indicator as the bearish trend line is drawn above them, touching vital spots indicating a southward path that price over time has been pushing in what looks like a correction. The Stochastic Oscillators are closely above range 40, seemingly trying to open the conjoined lines northbound. That means the base crypto may strive to push upside as compared with the flagship counter crypto.
Looking to buy or trade XRP (XRP) now? Invest at eToro!
67% of retail investor accounts lose money when trading CFDs with this provider.
Read more:
- How to buy Ripple
- How to buy cryptocurrency